创建 Node-Exporter
- https://github.com/prometheus/node_exporter
1
2
3
4
5
6
7
8
9
| docker run -d \
--name node-exporter \
--restart always \
--net host \
--pid host \
-m 512m \
-v /:/host:ro,rslave \
prom/node-exporter:latest \
--path.rootfs=/host
|
创建 Prometheus
- https://github.com/prometheus/prometheus
1
2
3
4
5
6
7
8
9
10
11
12
13
14
|
global:
scrape_interval: 30s
evaluation_interval: 60s
scrape_configs:
- job_name: "prometheus"
static_configs:
- targets:
- "127.0.0.1:9090"
- job_name: "node"
static_configs:
- targets:
- "127.0.0.1:9100"
- "127.0.0.2:9100"
|
1
2
3
4
5
6
7
8
9
| docker run -d \
--name prometheus \
--restart always \
--user root \
-p 9090:9090 \
-m 2048m \
-v /opt/docker/prometheus/config/prometheus.yml:/etc/prometheus/prometheus.yml \
-v /opt/docker/prometheus/data:/prometheus \
prom/prometheus:latest
|
创建 Grafana
- https://github.com/grafana/grafana
1
2
3
4
5
6
7
| docker run -d \
--name grafana \
--restart always \
--user root \
-p 3000:3000 \
-v /opt/docker/grafana:/var/lib/grafana \
grafana/grafana:latest
|
配置 Grafana
配置 DataSources
在地址 {$server_url}/datasources/new 选择 Prometheus,在 URL 处填写地址。
- 如果使用
docker 部署 Grafana,需通过宿主机访问 Prometheus,所以地址可能是 http://172.17.0.1:9090。
导入 Dashboard
- https://grafana.com/grafana/dashboards/8919
这里推荐使用上面的模版,在地址 {$server_url}/dashboard/import 输入 id 8919 然后保存即可。
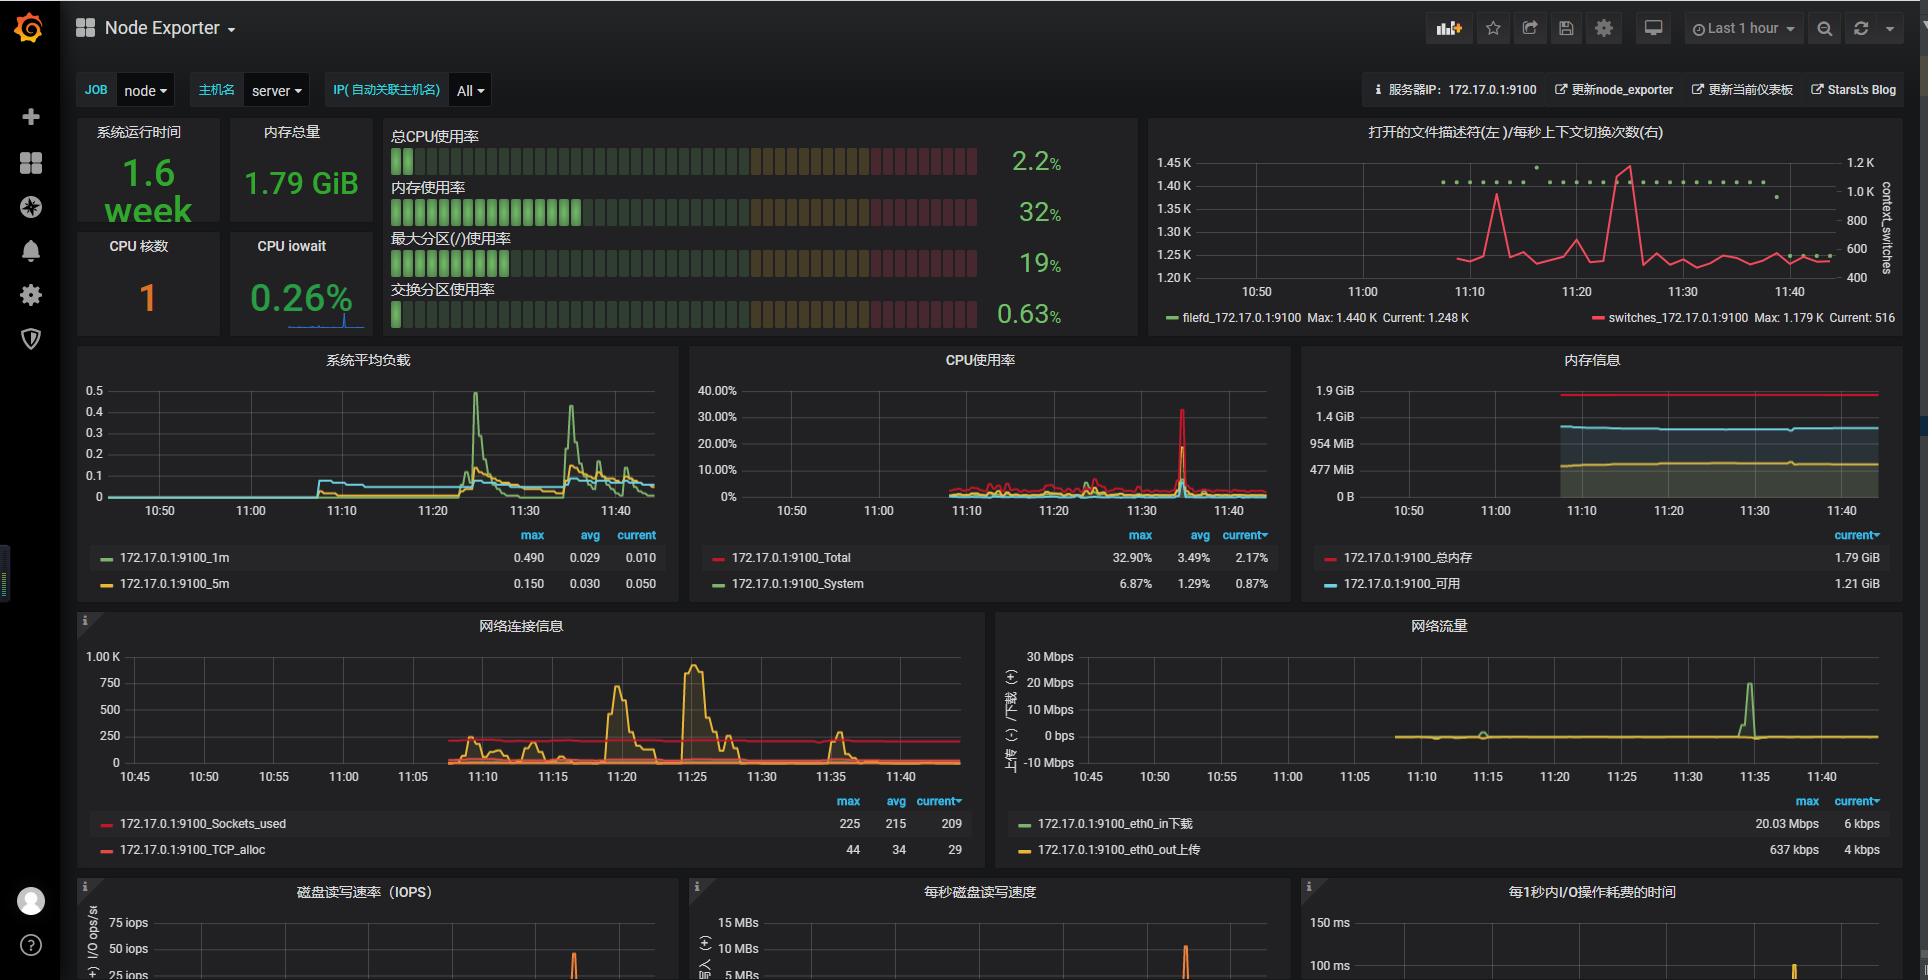
预览
![预览]()